
Product and marketing analytics without a separate tool
Reports use the same events as segments and journeys: no need to send data to yet another analytics service and reconcile the numbers. Funnels, cohorts, revenue, traffic sources and the impact of campaigns on sales — in one platform.
A report on any event
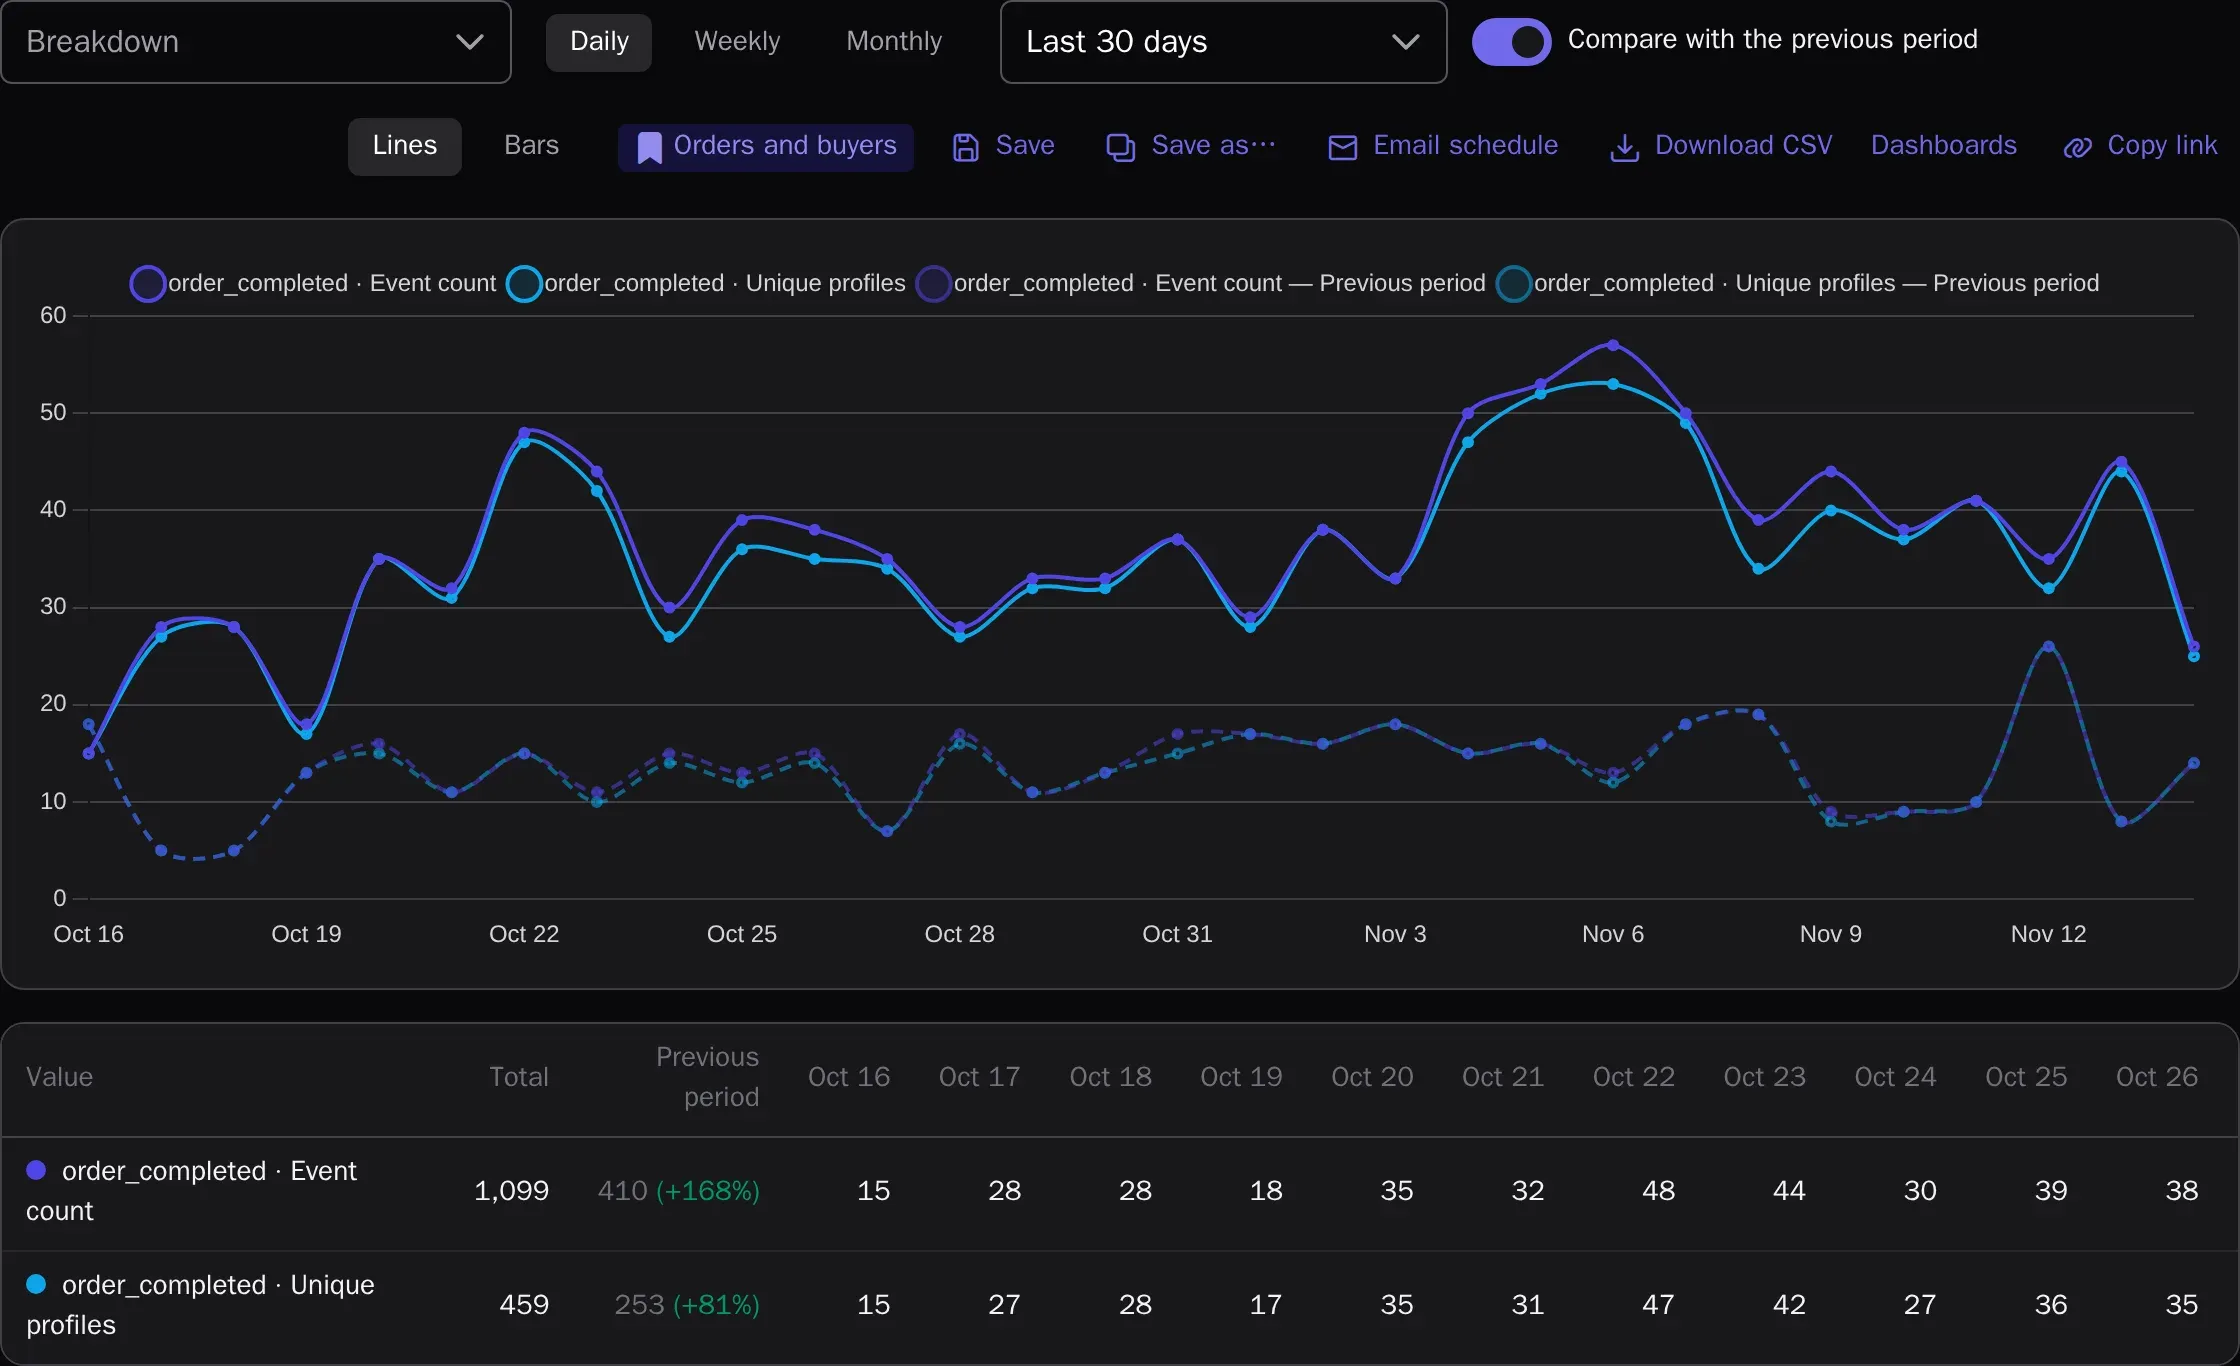
Event counts, unique customers, sum or average of a property by day, week or month — with filters, breakdowns and comparison to the previous period.
- Up to five series on one chart
- Breakdown by event property, page or UTM tag
- Reports for a segment or customers with specific traits
Funnels and retention
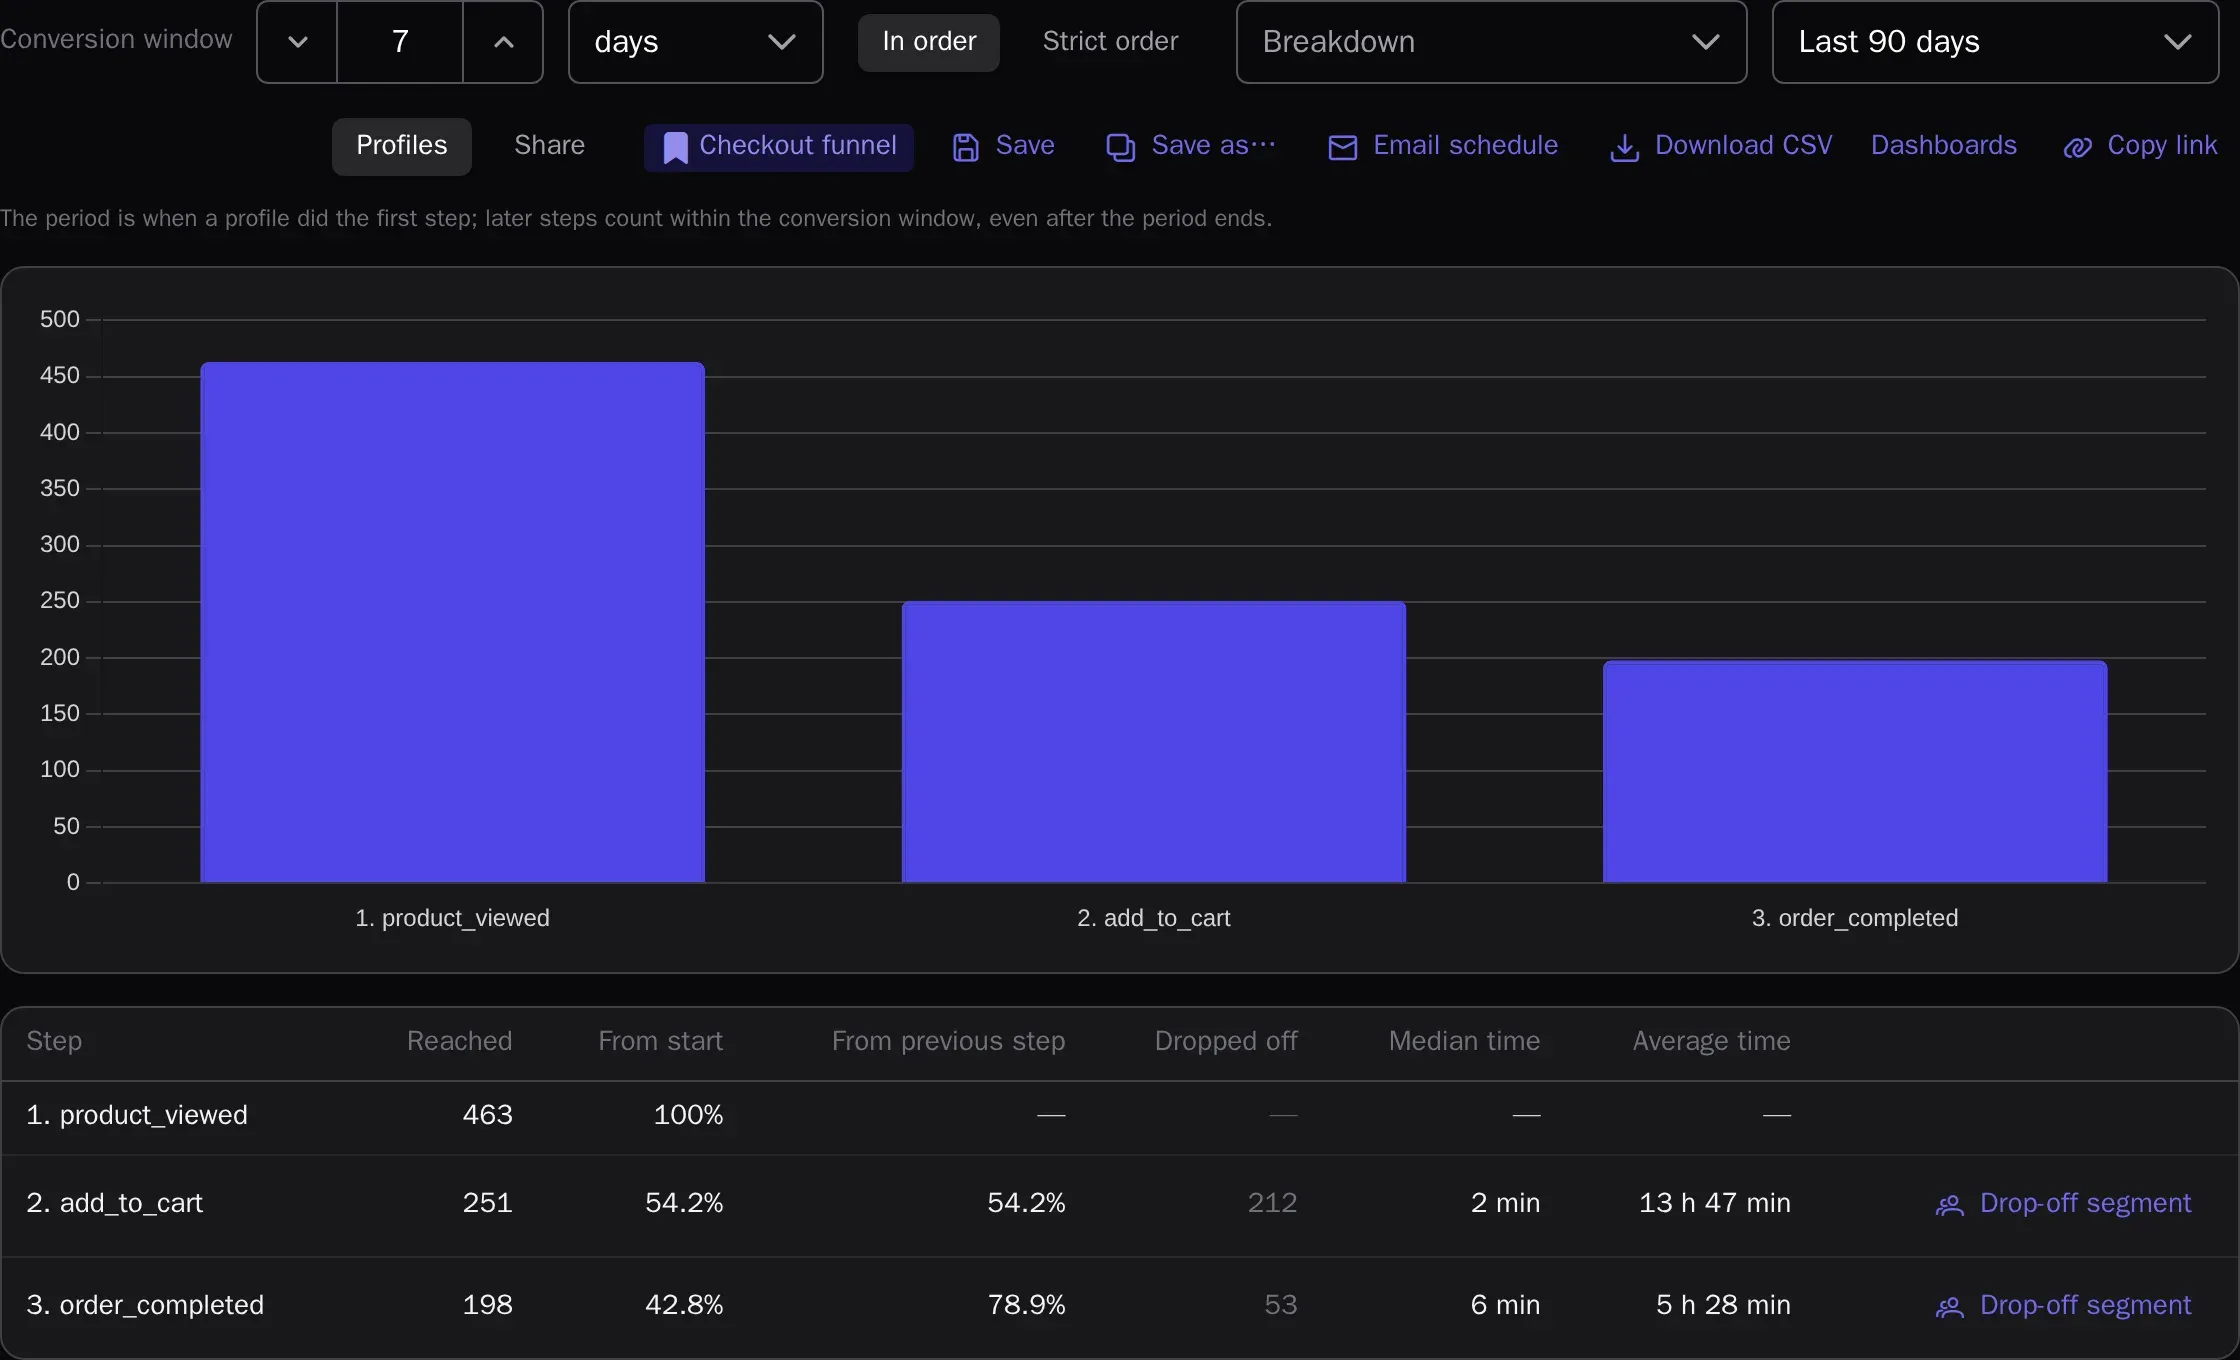
See at which step customers drop off and how long each step takes. Turn drop-offs into a segment in one click and win them back with a campaign. Cohorts show whether customers come back after a week and after a month.
Customer paths
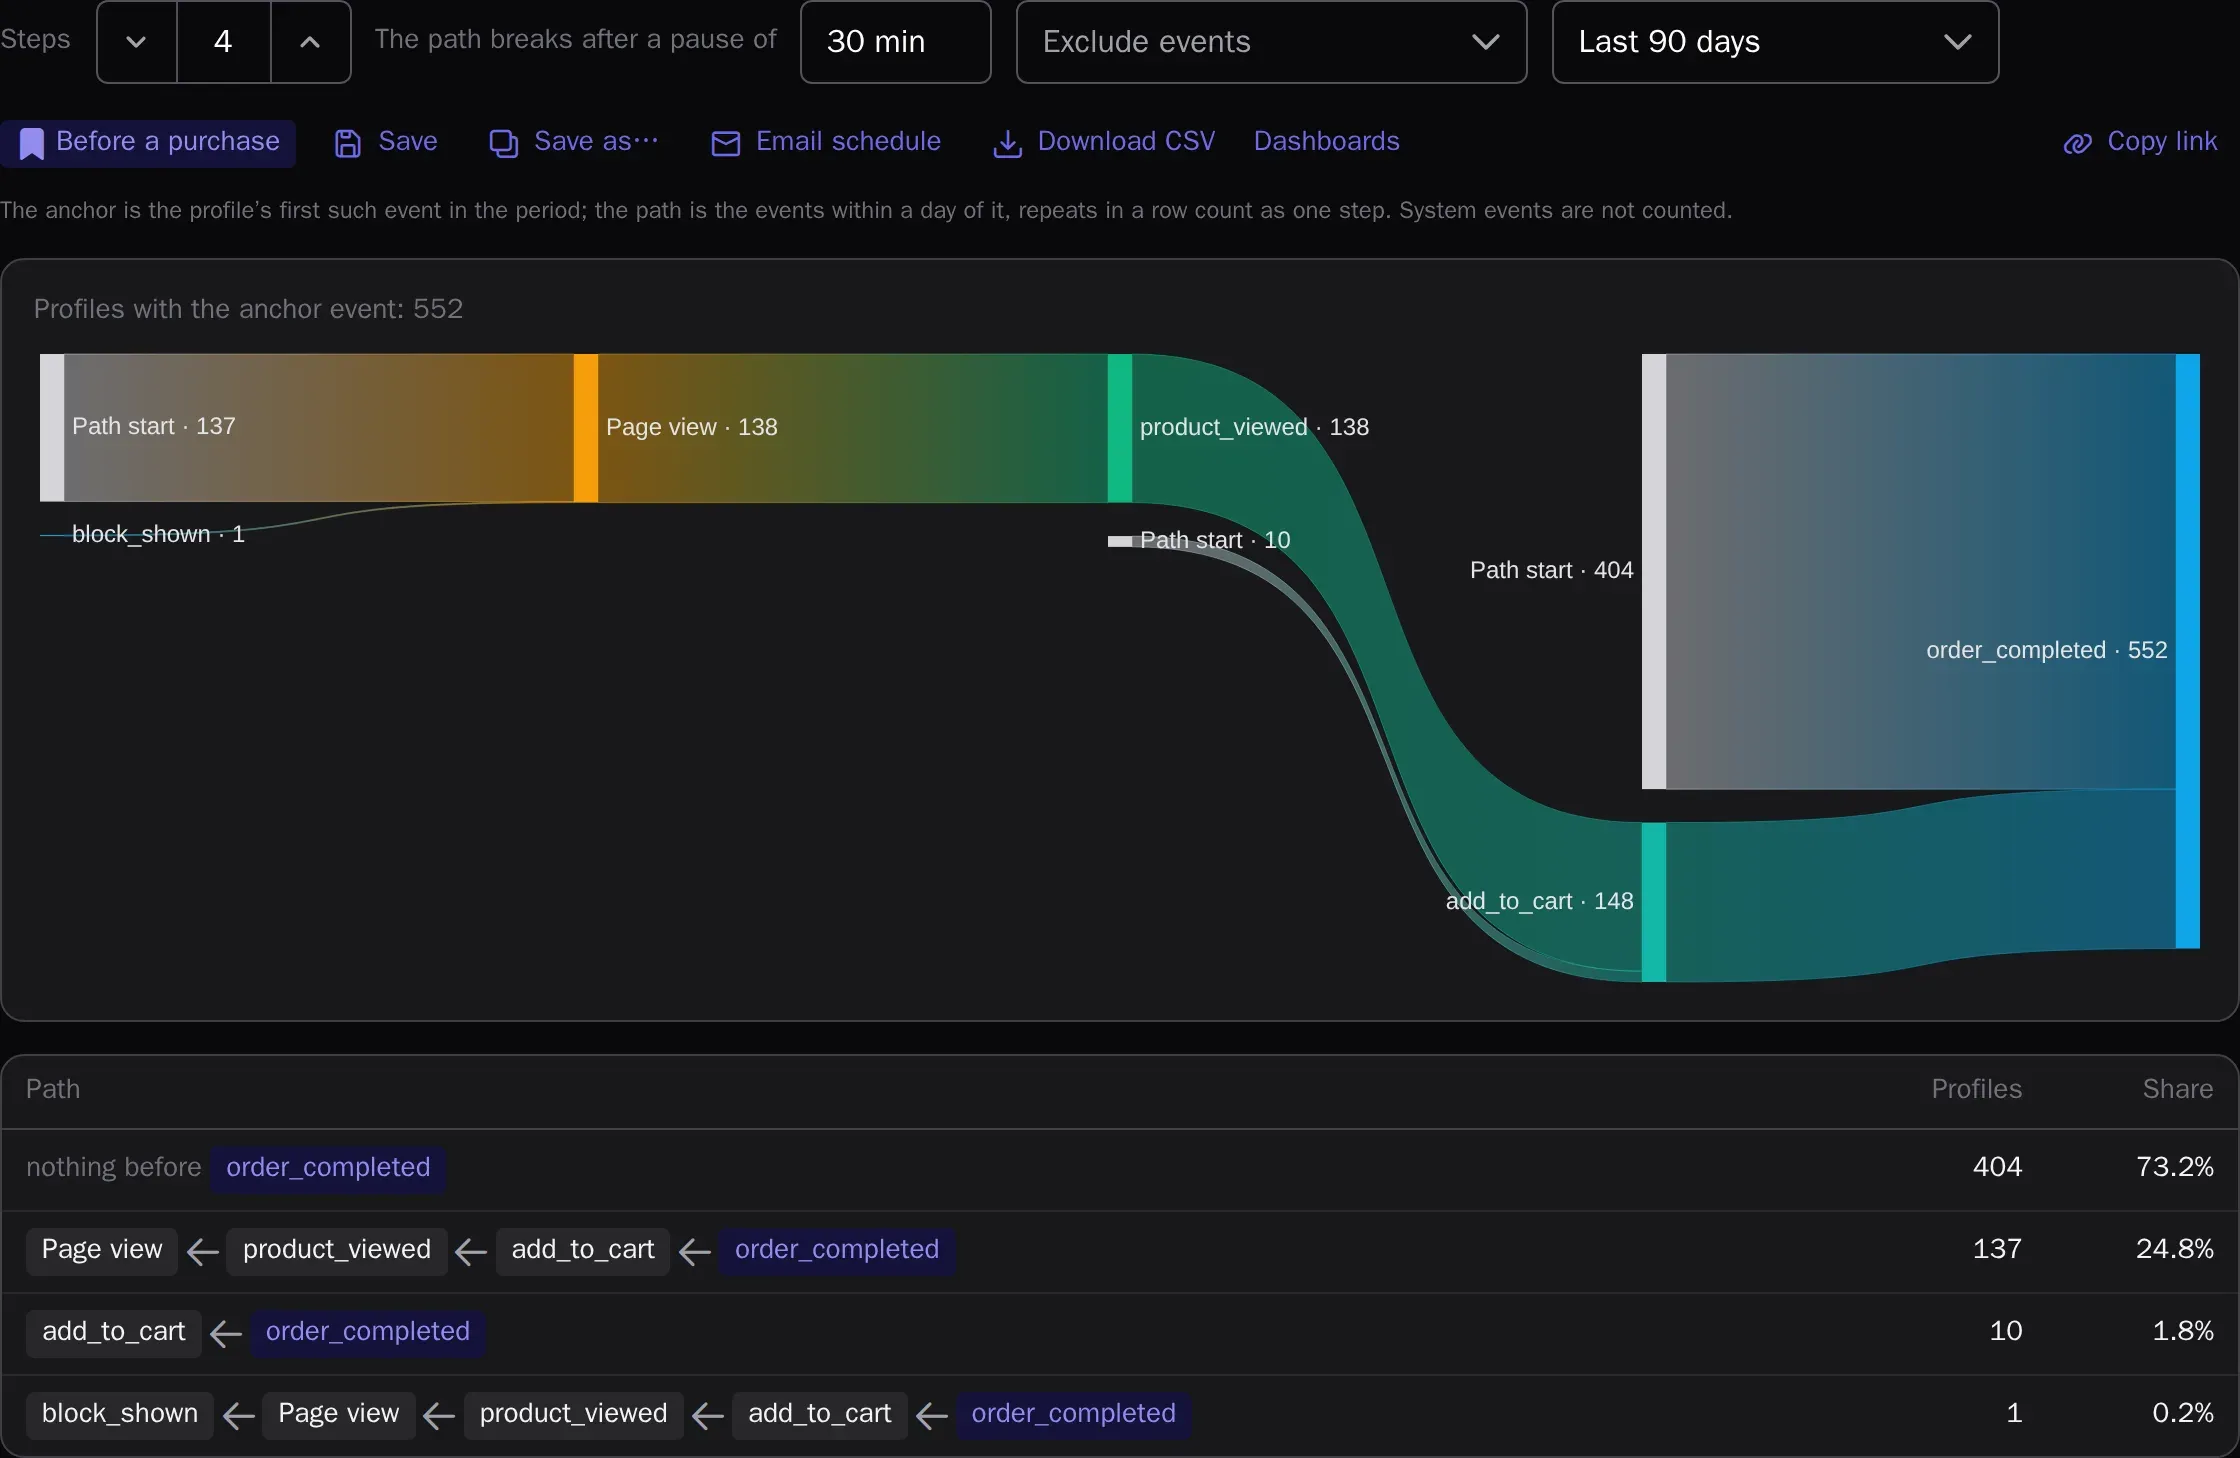
What customers do after a chosen event and what they did before a purchase — a flow diagram and the most frequent sequences step by step.
Revenue and LTV
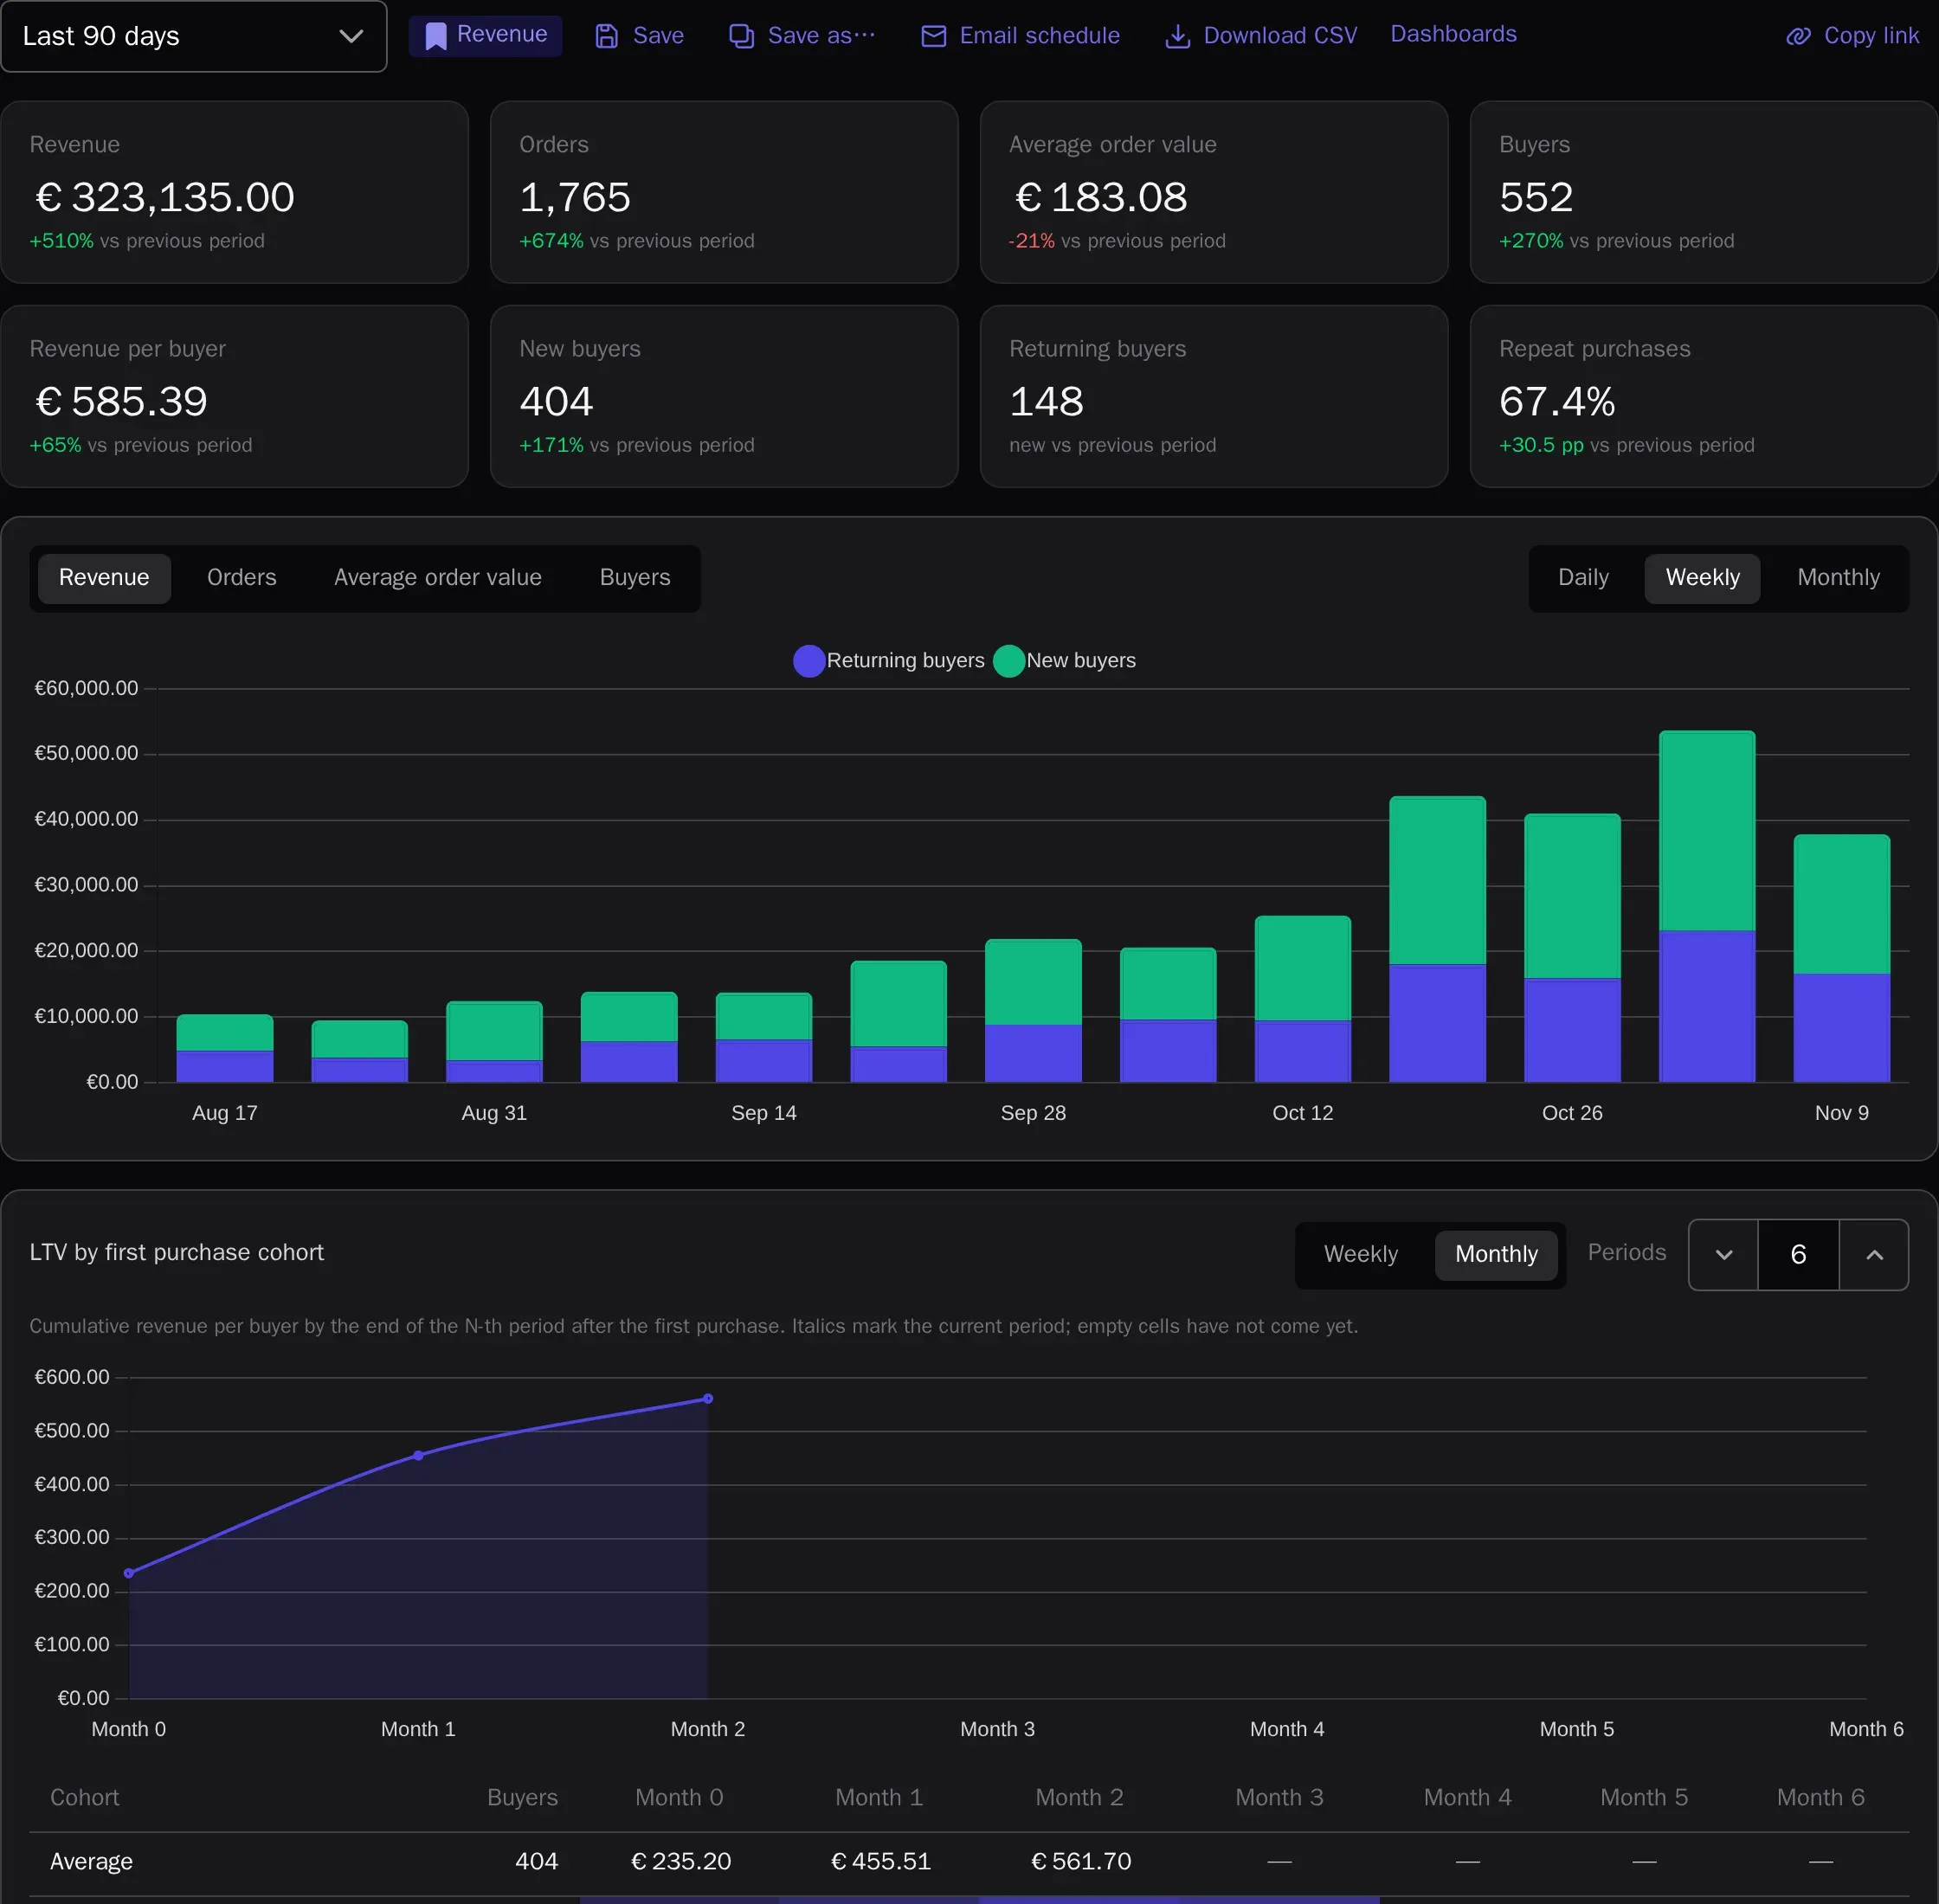
Revenue, orders, average order value, new and returning buyers, repeat purchases, LTV by first-purchase cohort, top products and categories — in your project currency.
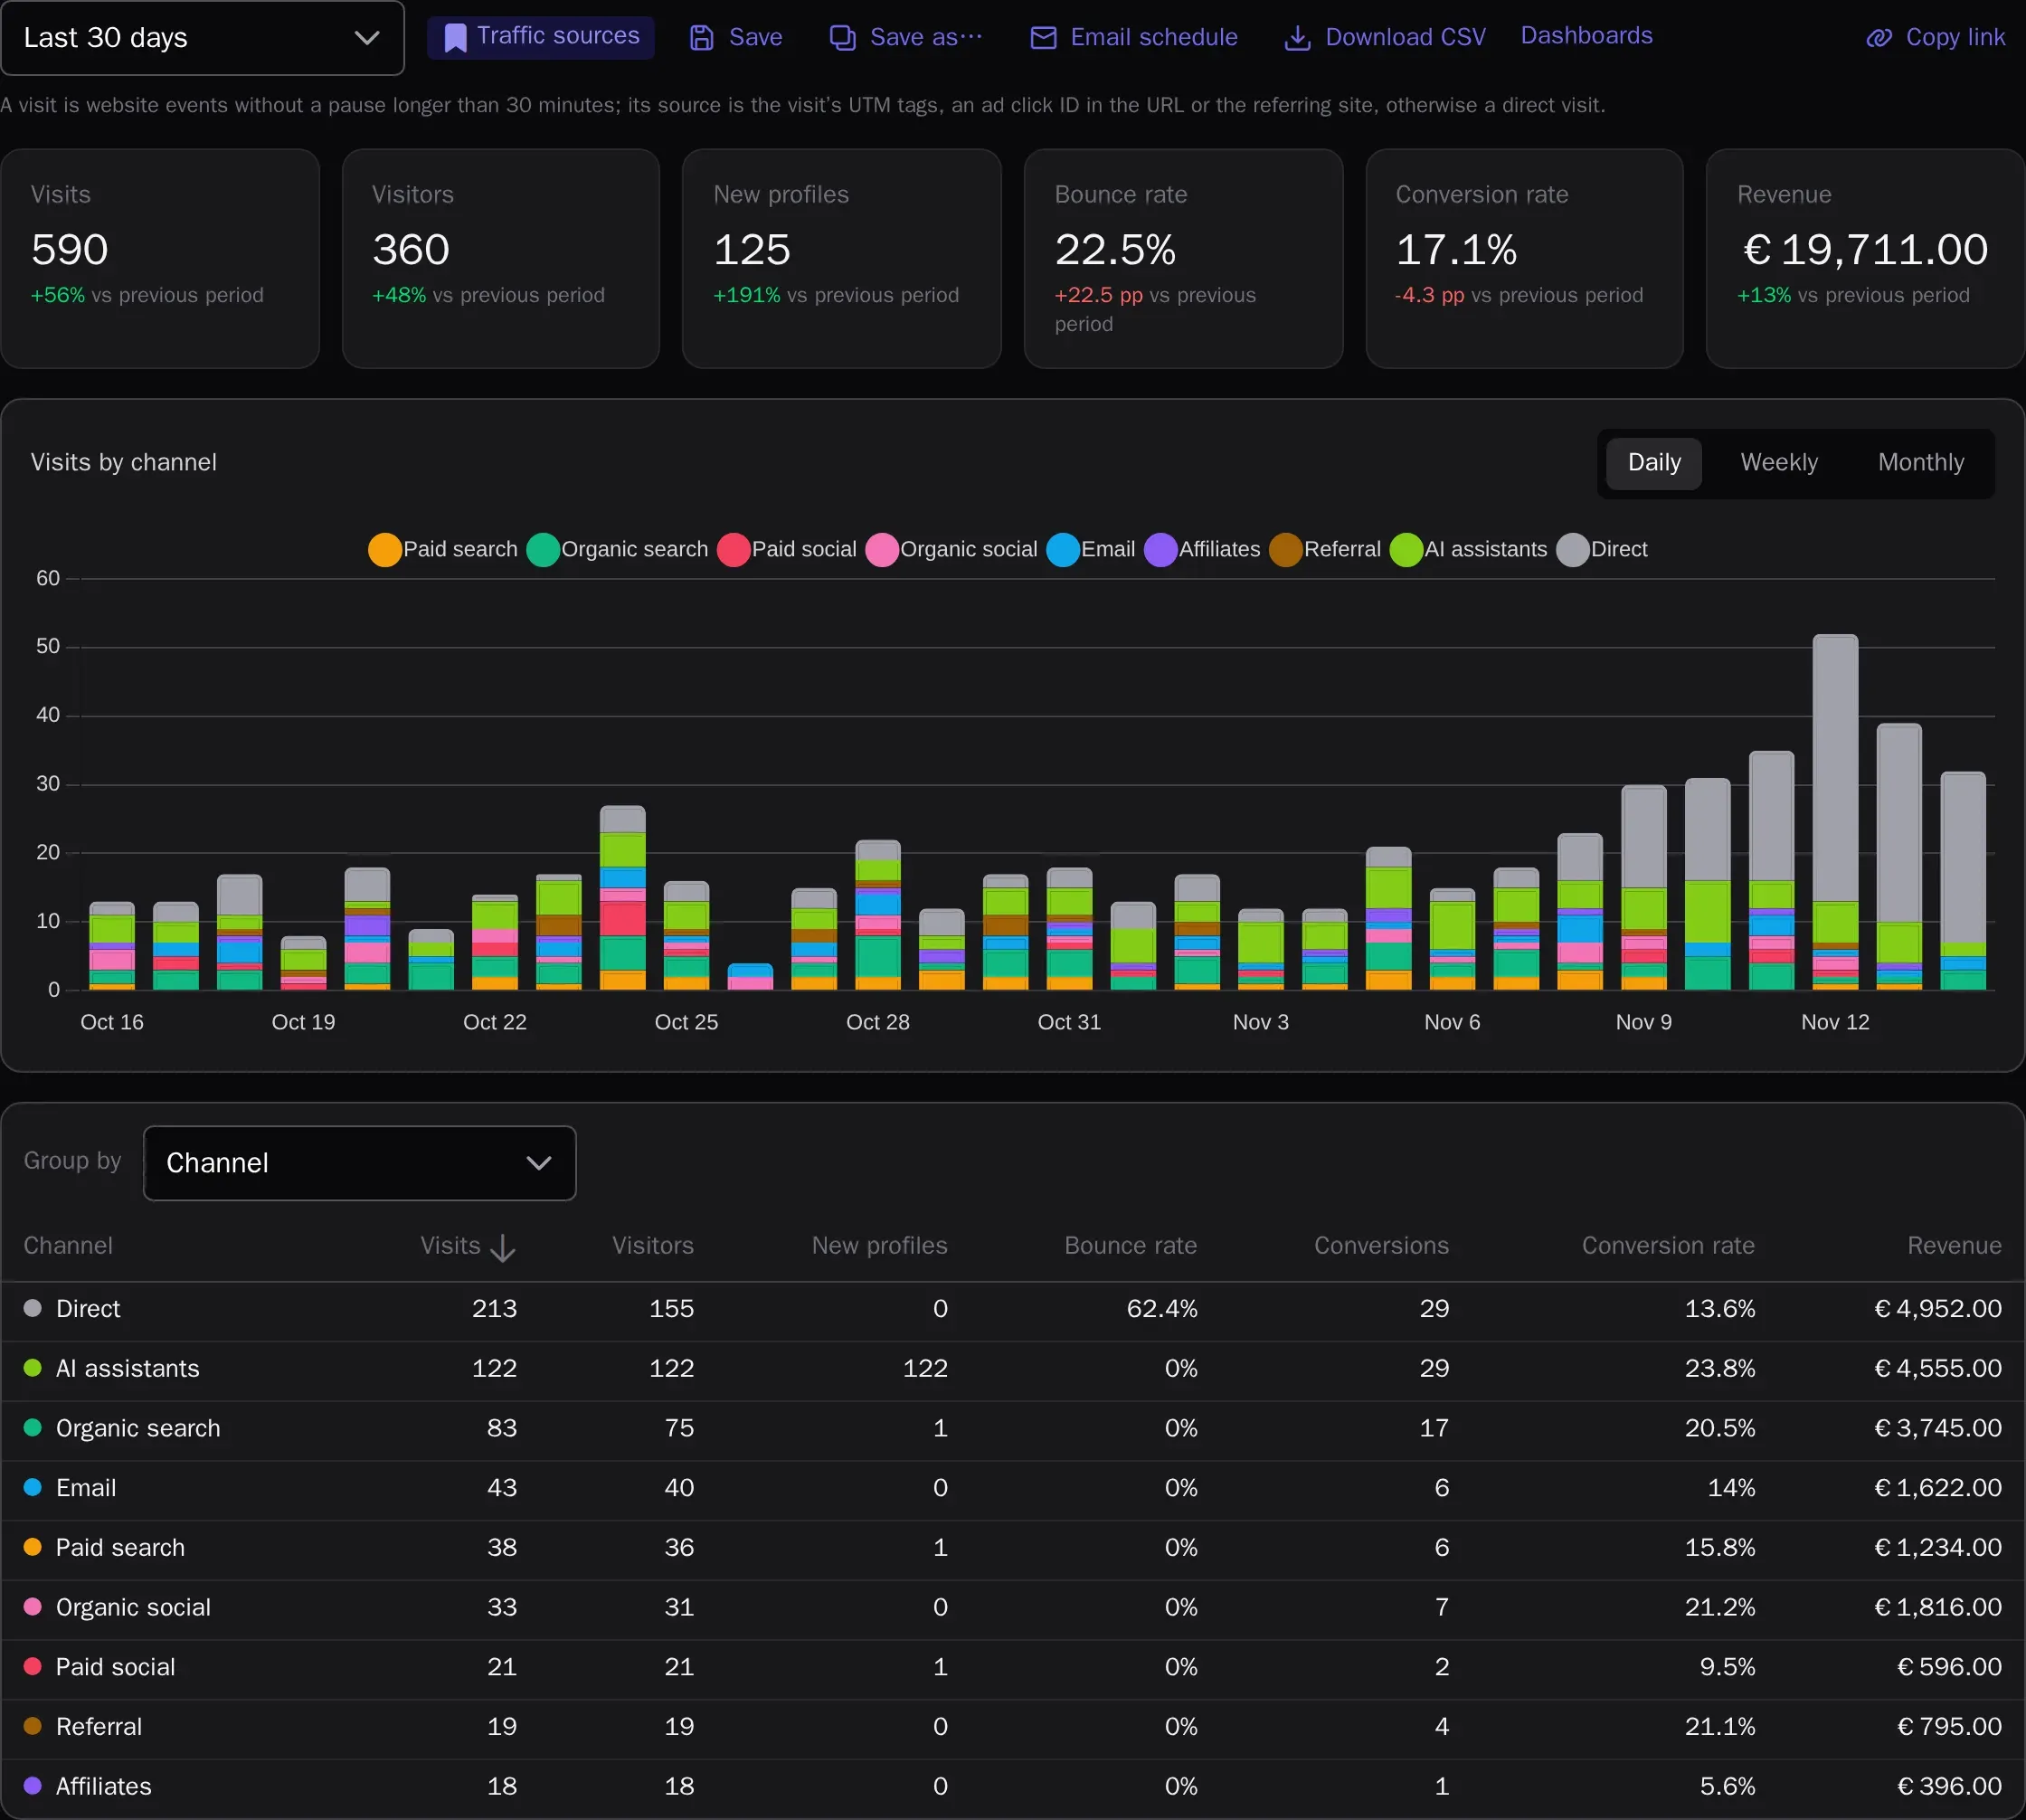
Traffic sources
Visits by channel, source, campaign and landing page — with new customers, bounces, conversion to purchase and revenue. Channels are detected from UTM tags, ad click IDs and the referring site.
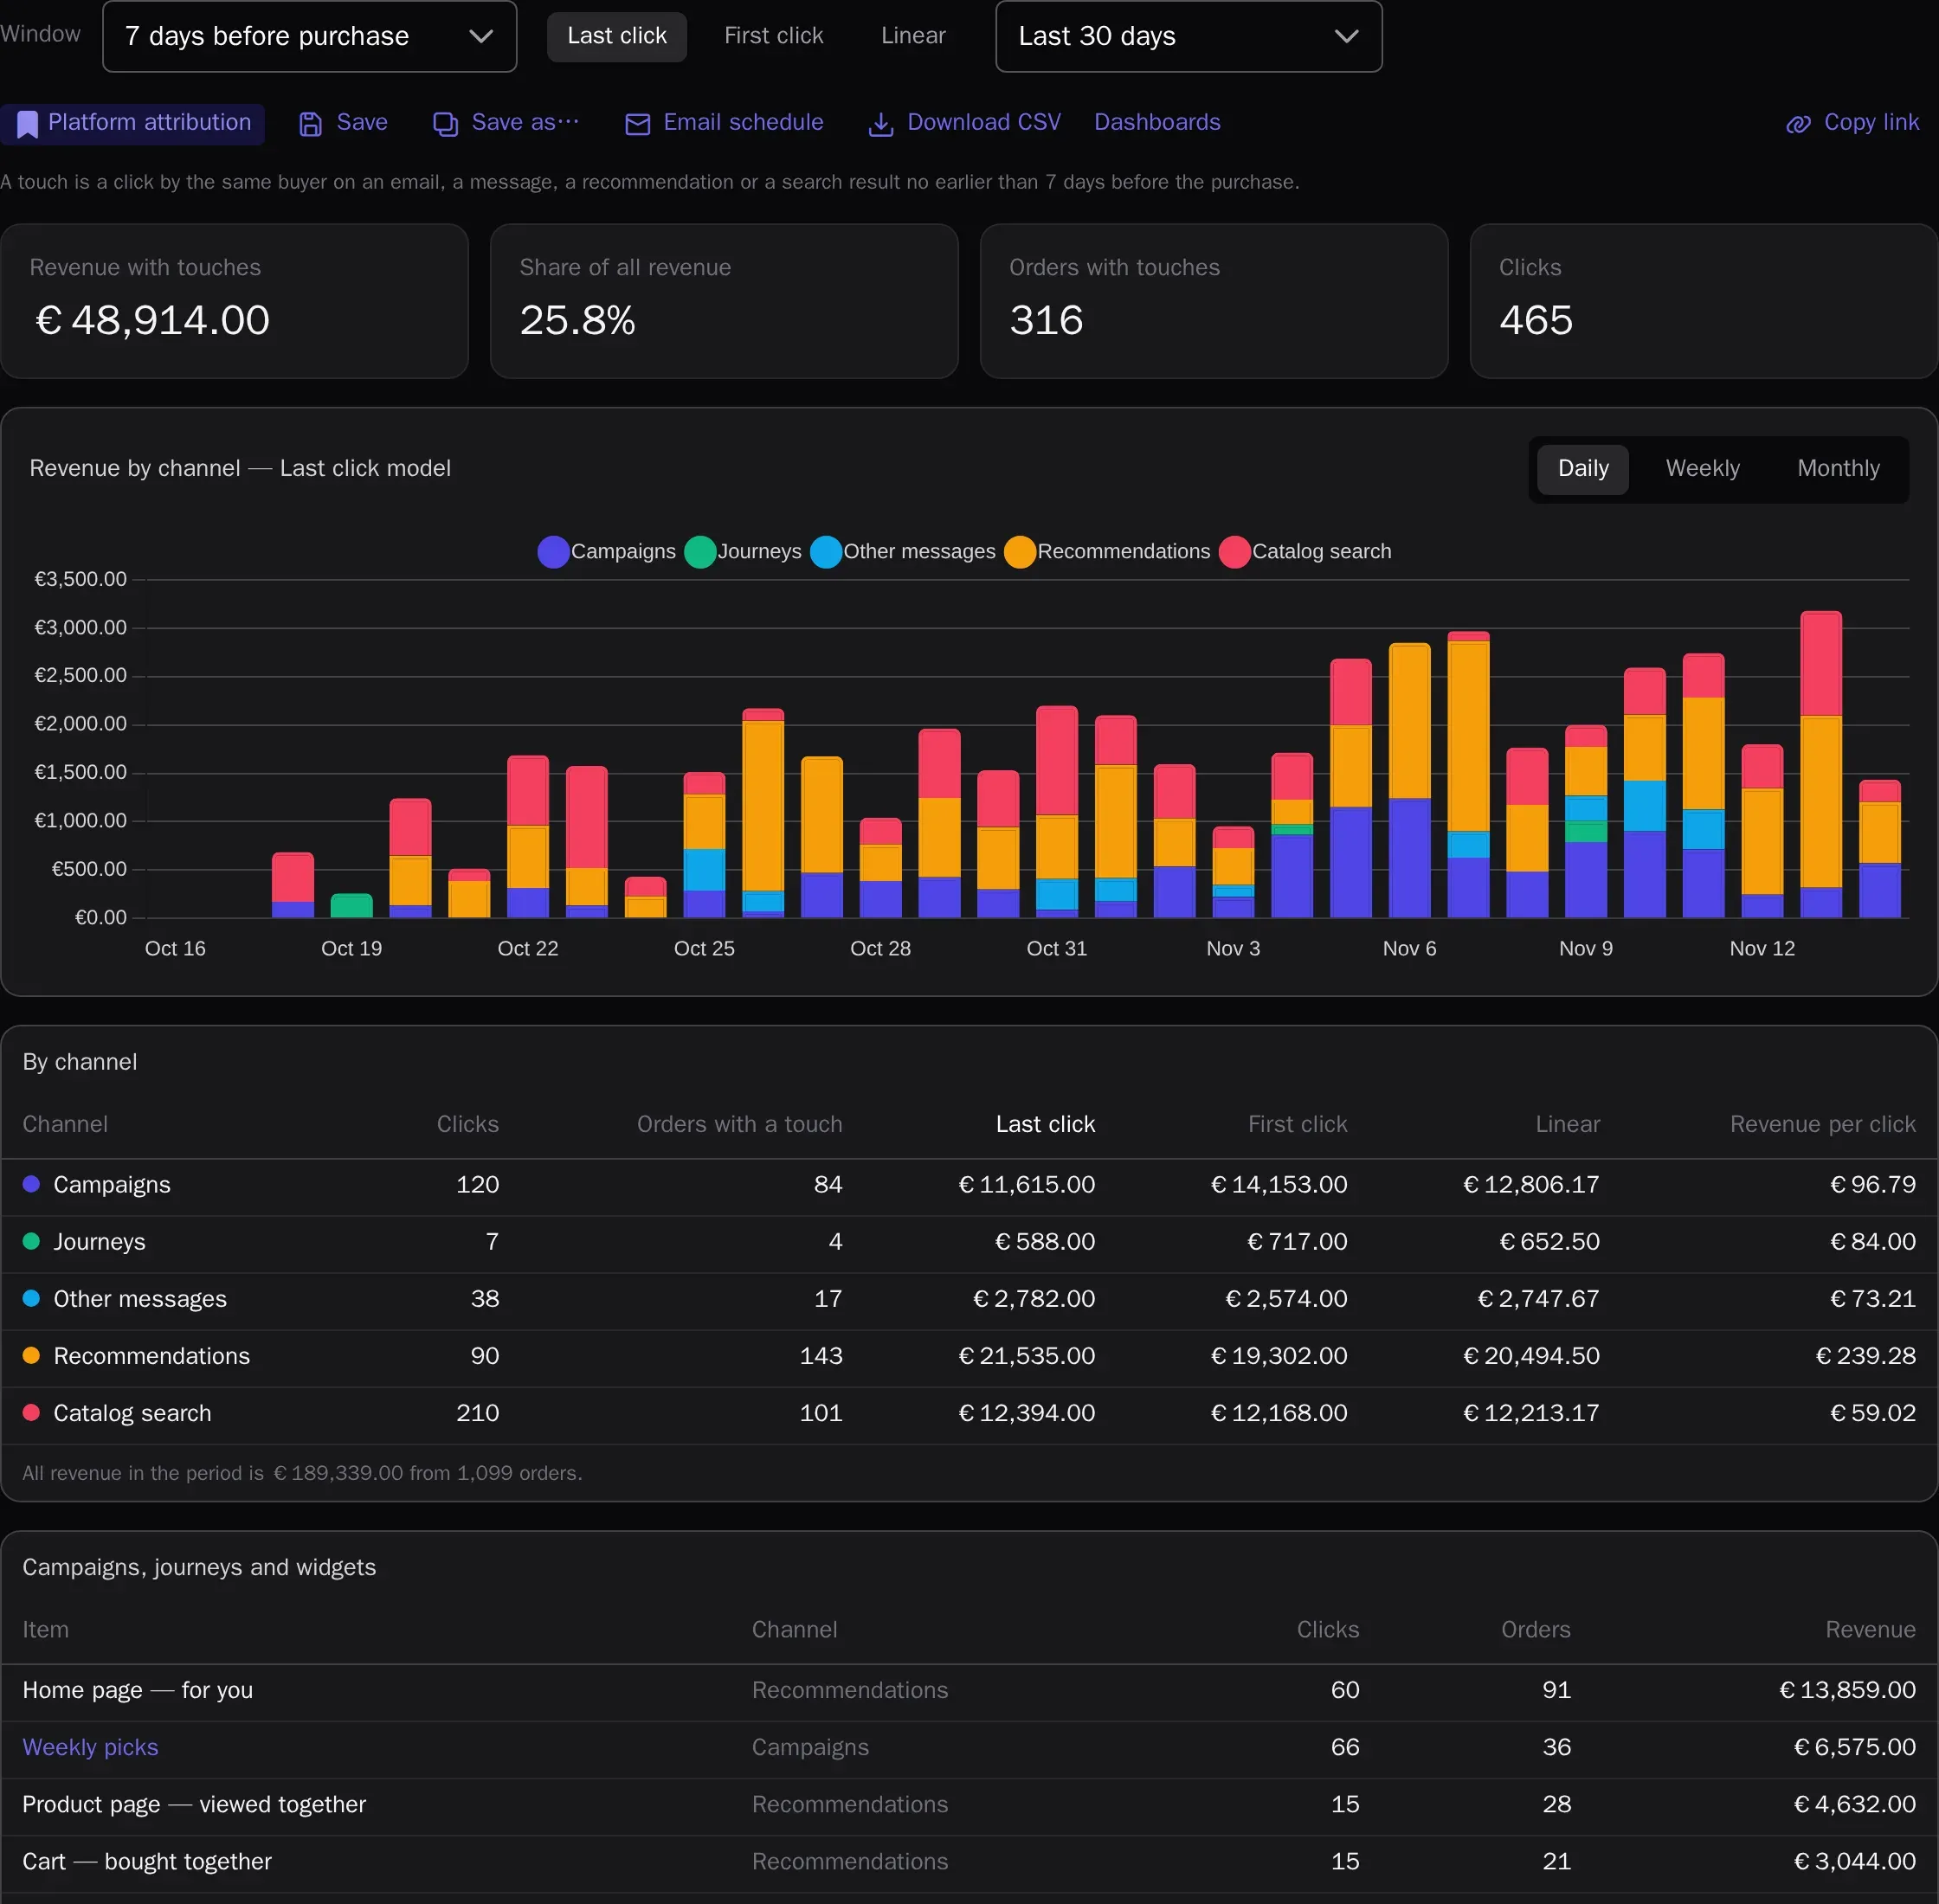
Channel impact on sales
Attribution links orders to clicks on campaigns, journeys, recommendations and catalog search before the purchase. Last-click, first-click and linear models side by side in one table.
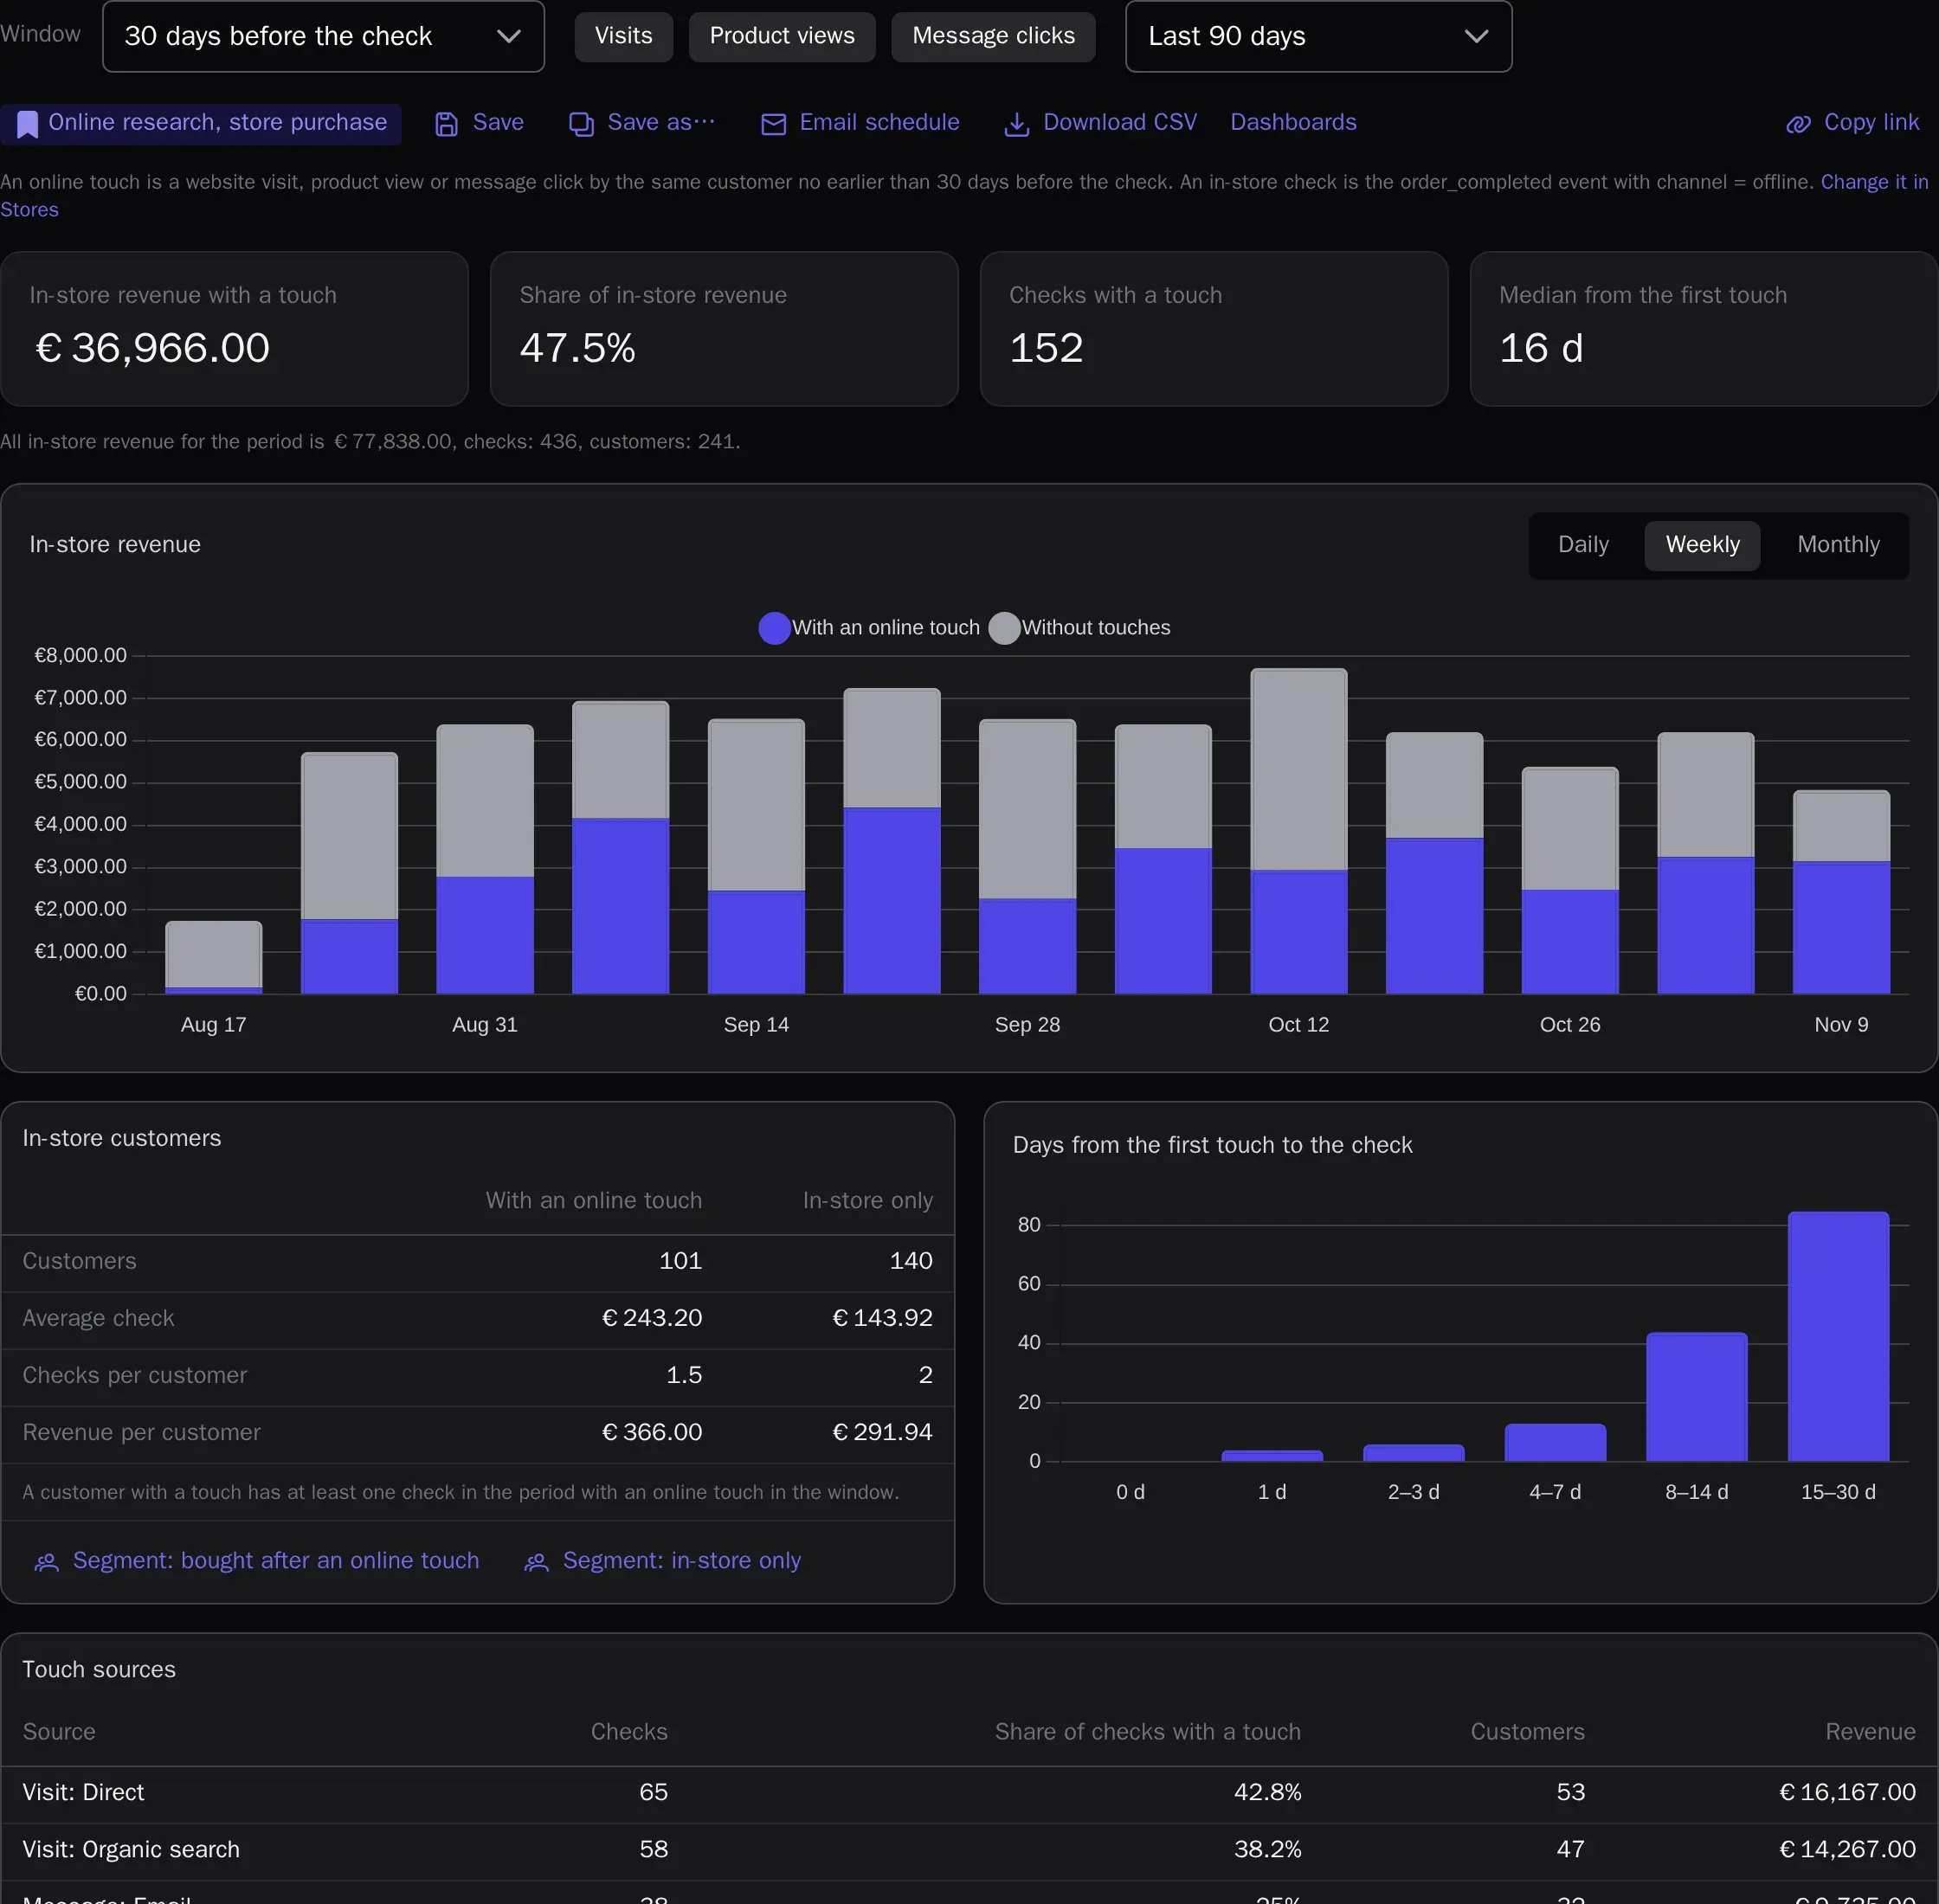
In-store purchases after online research (ROPO)
Store receipts are linked to the customer’s online history by phone, email or loyalty card. The report shows how much in-store revenue comes from customers who visited the website, viewed the product or clicked an email first, which channels and stores it comes from — and the reverse: online orders after a store visit.
- Receipts via the 1C extension, the API, a data source or a CSV or Excel file
- “Viewed online, bought in store” products and a comparison of customers with and without online touches
- “In-store purchase” segment condition and journey trigger
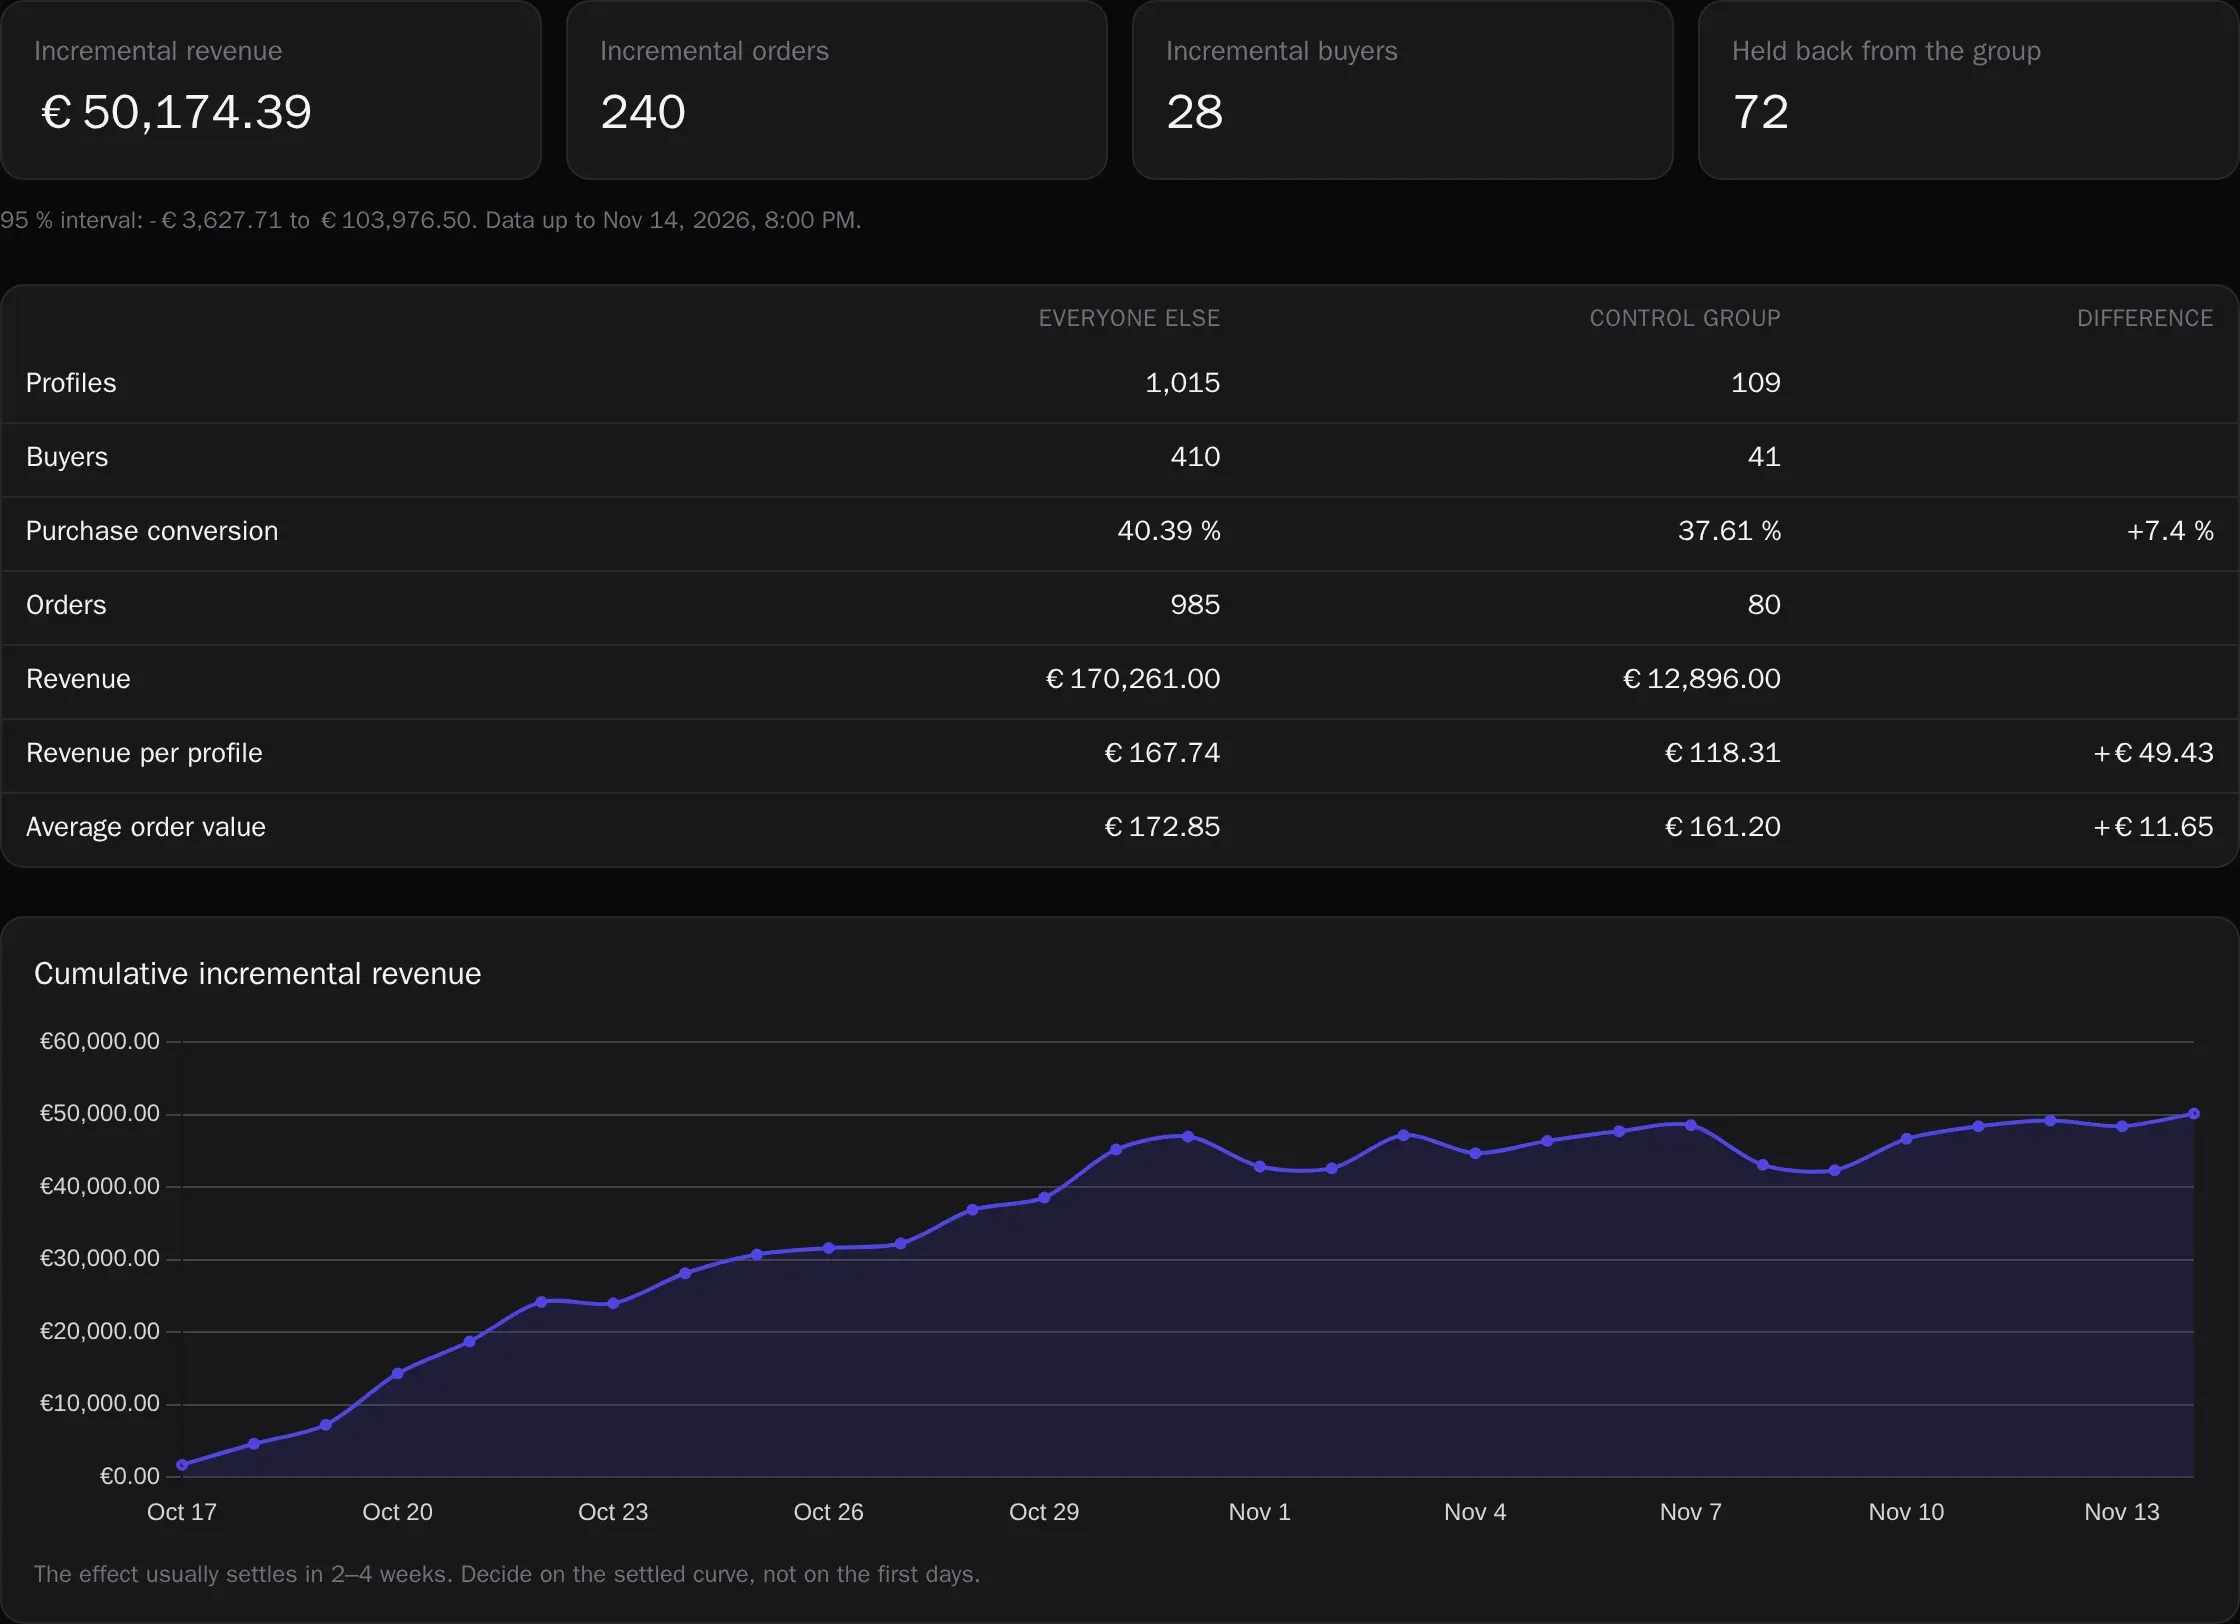
Global control group
A small random share of customers receives no marketing messages, and the report compares their purchases with everyone else. The difference is the revenue, orders and buyers you would not have without campaigns and journeys — with significance and the cumulative effect by day.
- A share from 1 to 50 %, all channels: campaigns, journeys, cascades, API
- Transactional messages reach everyone; an important campaign can go to the group too
- The effect of a single campaign: goal conversion of recipients against the group
Dashboards and scheduled reports
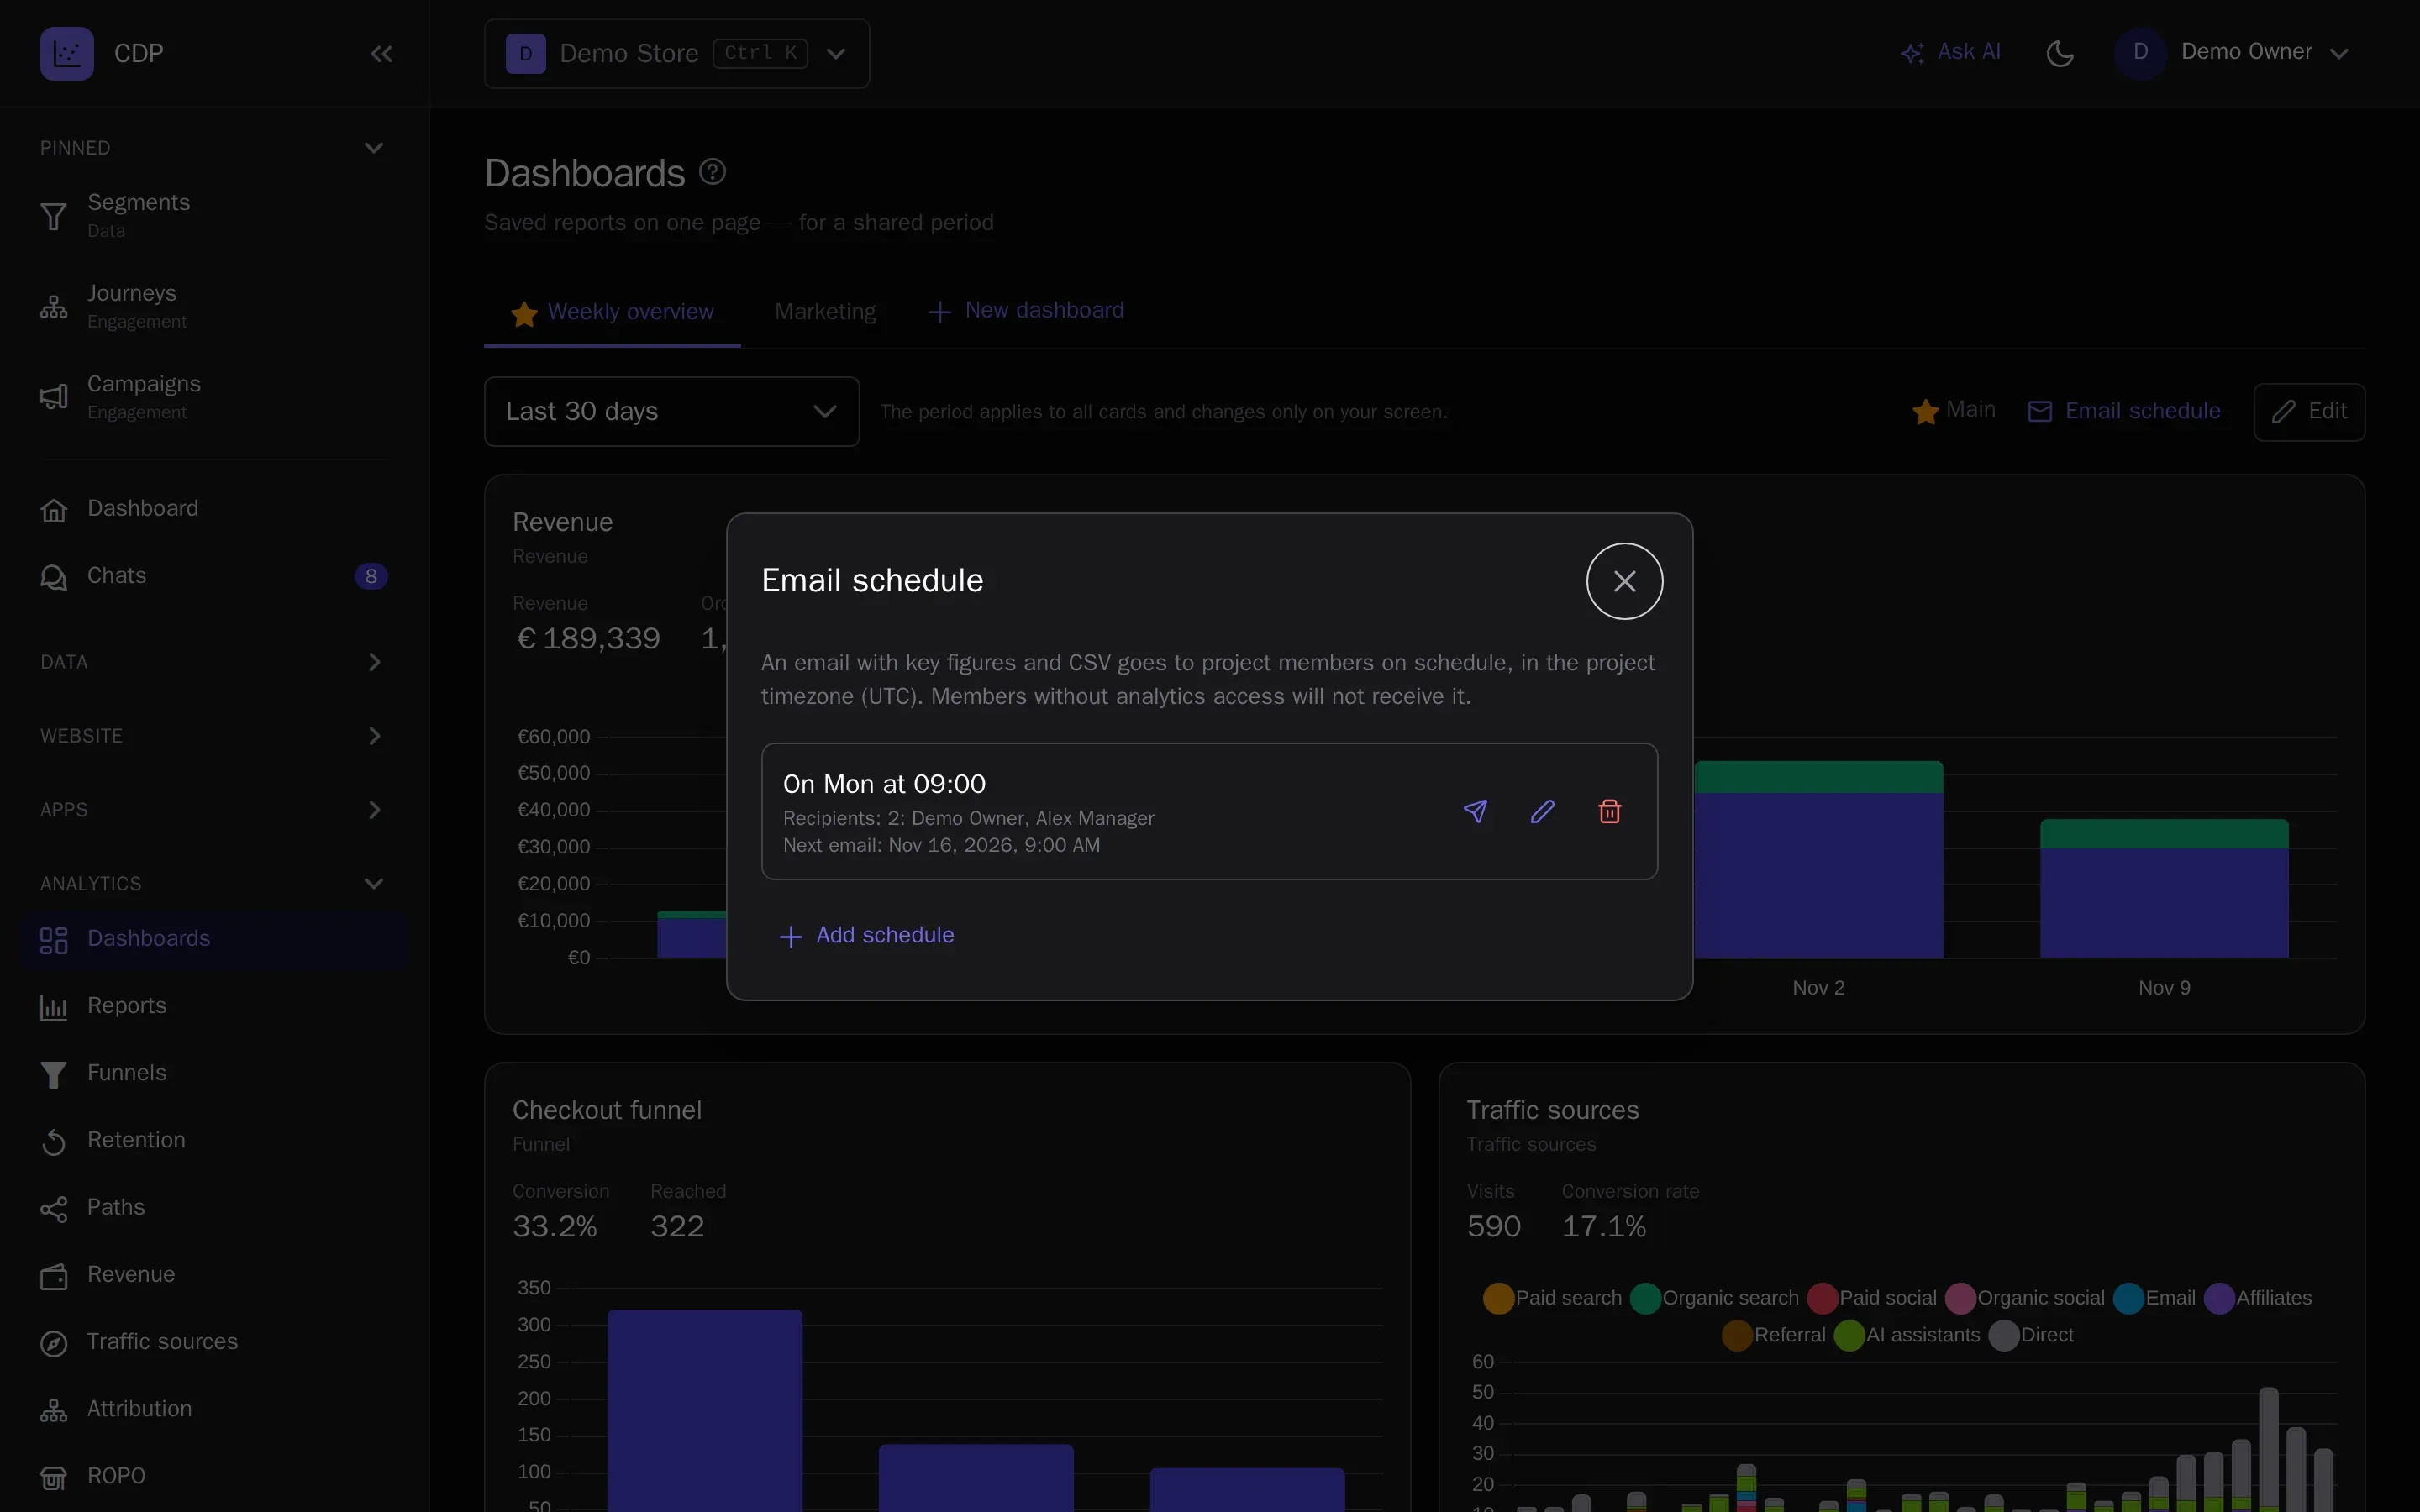
Saved reports come together on team dashboards. Get a dashboard or report by email on a schedule — with fresh numbers and CSV files.
- CSV export for any report
- Emails only to members with access to analytics
- Reports and dashboards via the API
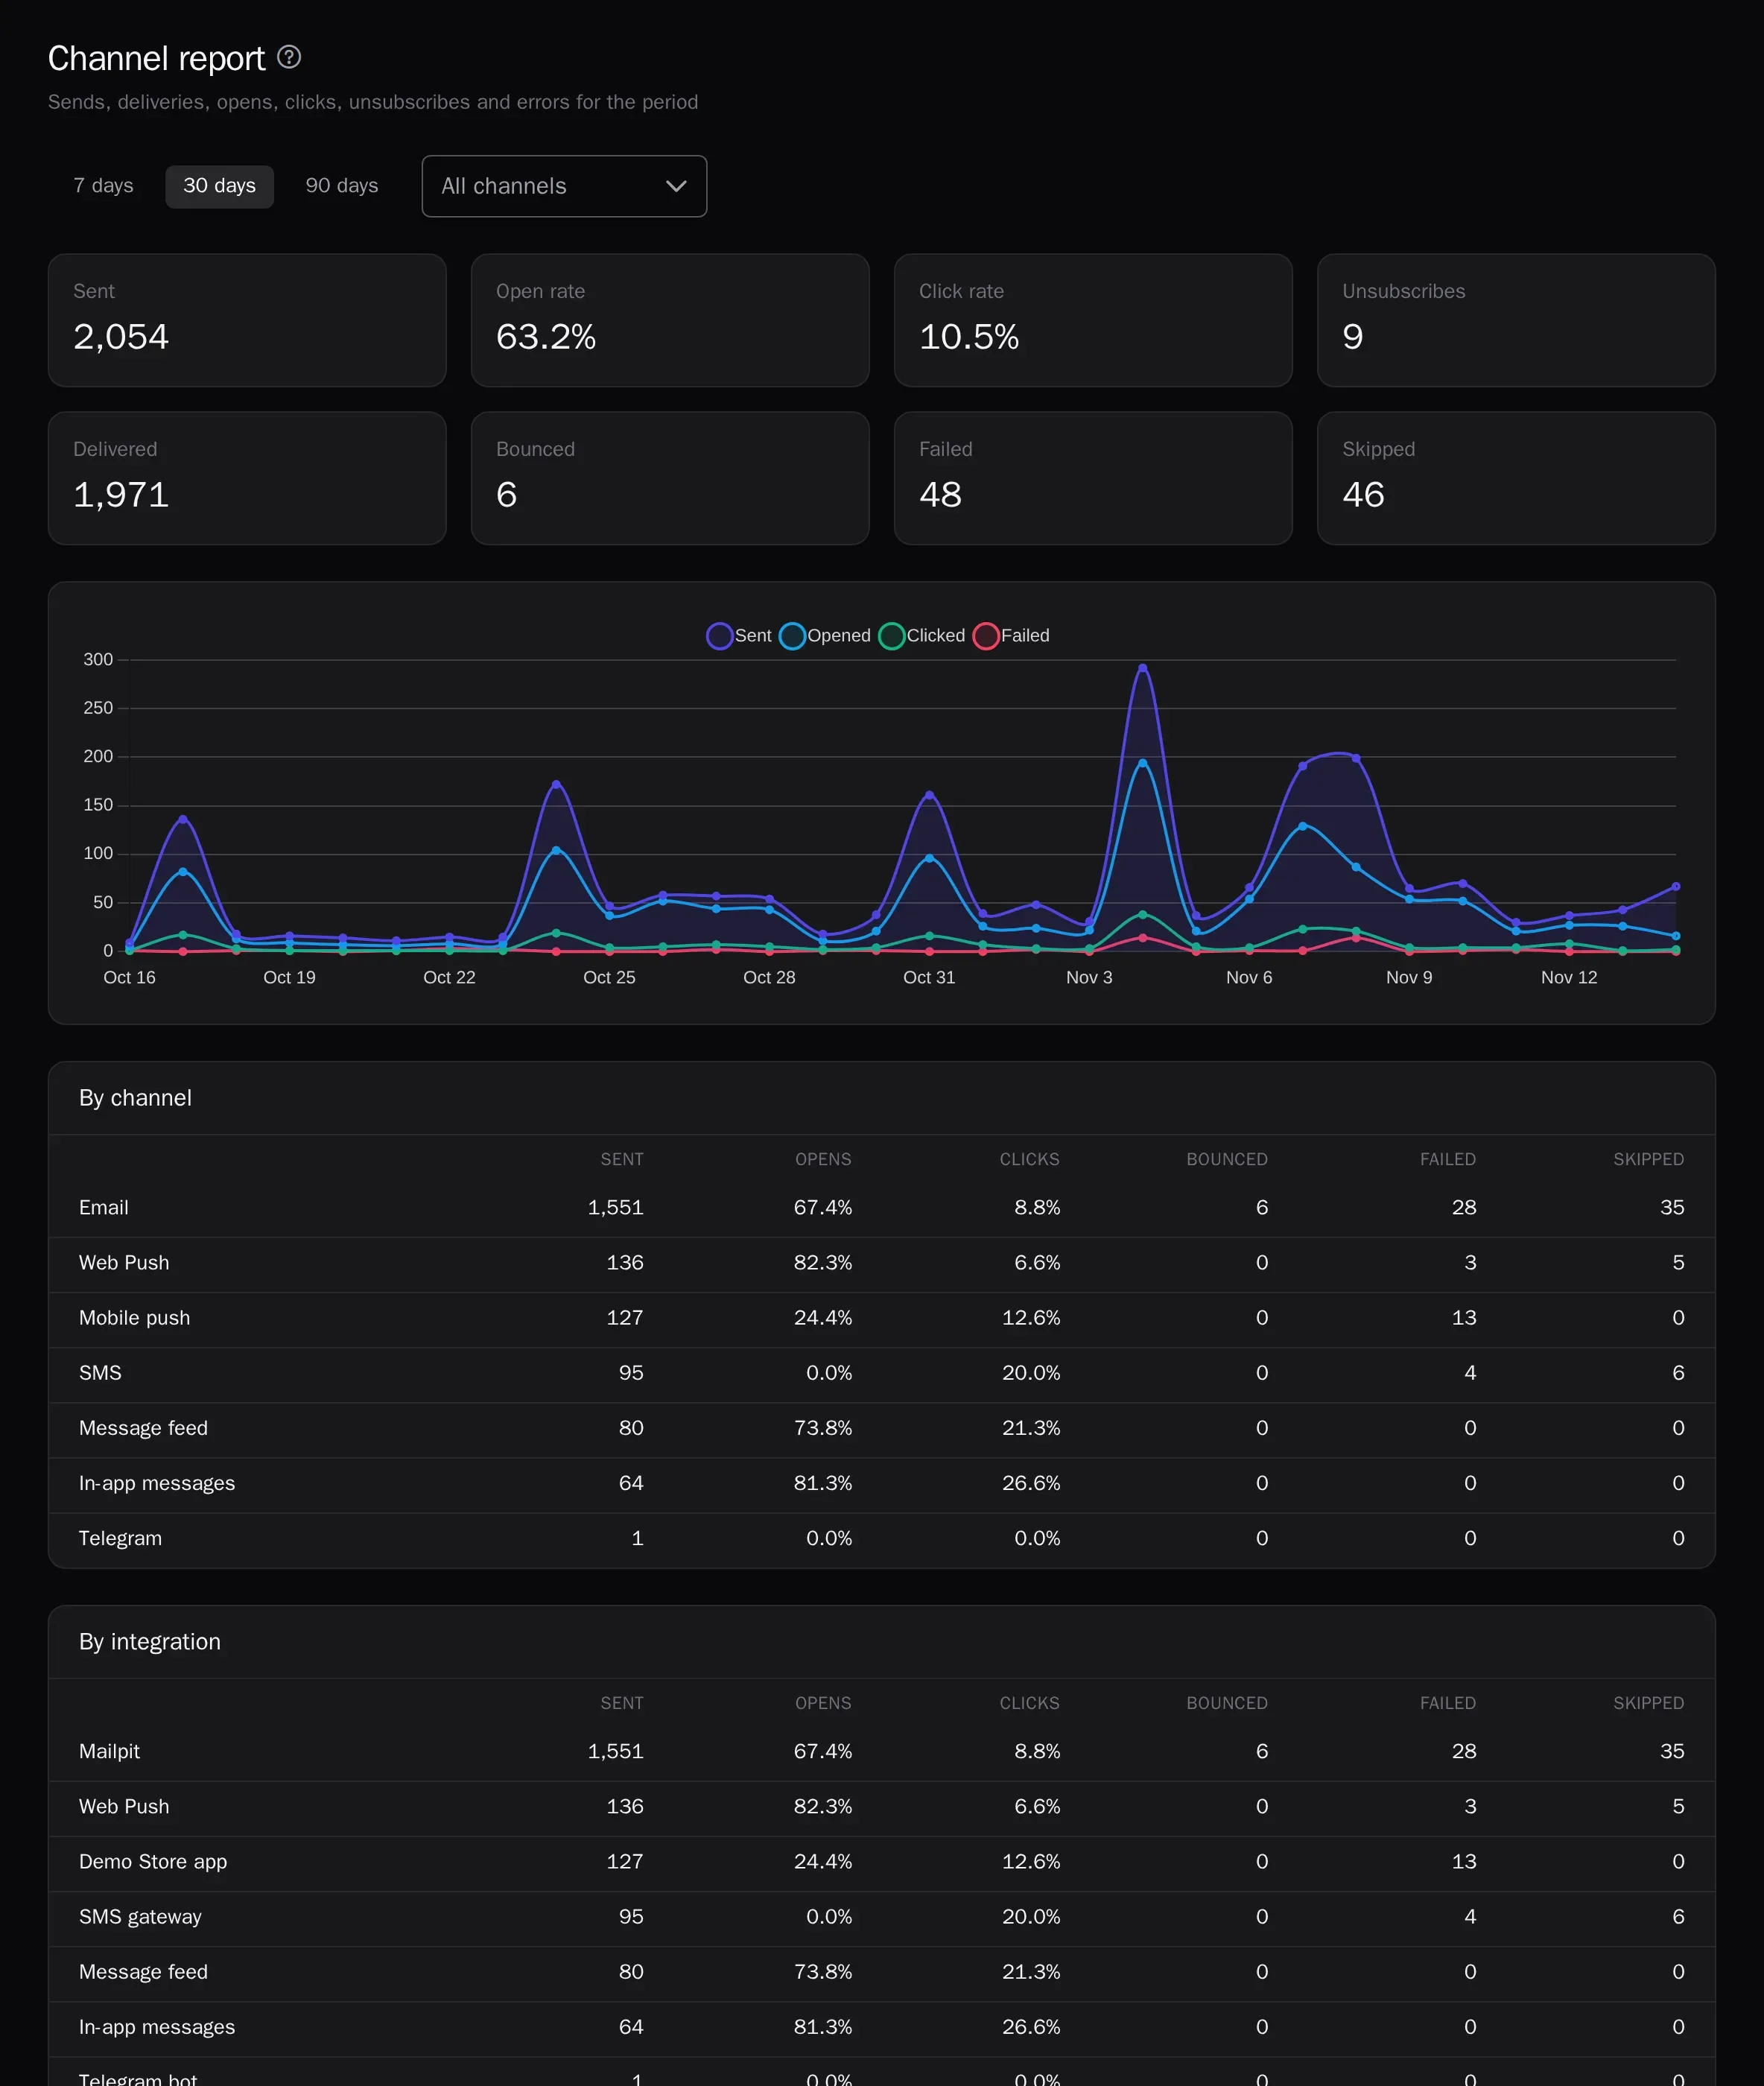
Messaging channel report
Deliveries, opens, clicks, unsubscribes and errors for every channel, integration and template, plus campaign and journey reports with A/B tests.
- Profiles and eventsA single customer profile from website, app and CRM events.
- SegmentsAudiences by events and attributes — in real time.
- PredictionsRFM, churn risk, purchase probability, revenue forecast, best send time and channel.
- JourneysVisual scenarios: triggers, waits, branches and A/B.
- LoyaltyPoints, paying with points, tiers, friend referrals, promo codes and Wallet cards.
- Channels and campaignsEmail, web and mobile push, in-app messages, SMS, messengers and A/B-tested campaigns.
- Live chatWebsite chat, messengers and email in one inbox for your whole support team, with the customer profile alongside.
- Signup formsPopups and website forms: the contact goes straight into the profile with consent.
- Recommendations and widgetsPersonal product picks on your site and in emails.
- AI assistantsThe in-app assistant figures things out and builds campaigns; Claude and ChatGPT over MCP.
- White-labelThe platform under your brand and domain.
Try it on your own data
14 days on the Growth plan, no card required: up to 1,000 profiles and 500 emails a day.